

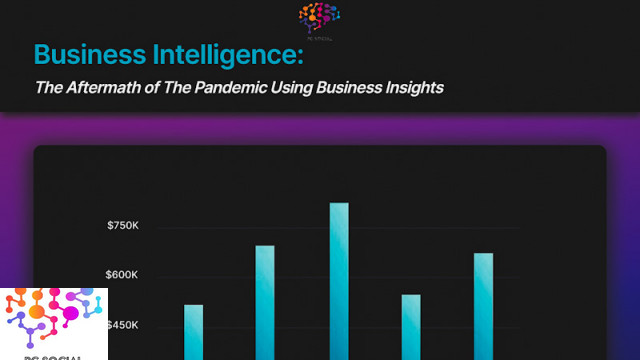
Business Intelligence: The Aftermath of The Pandemic Using Business Insights
By understanding what is happening within their business and the marketplace, businesses can identify opportunities and trends, make better informed decisions, and adapt more quickly to changes. The benefits of business insights are vast and can have a significant impact on a business’s bottom line.
Why Is Business Intelligence So Important?
The ability to gain insight into your business is critical to making smart decisions. It allows you to understand the health of your business and its components, which helps you to make better decisions. In addition, it provides information that can be used to improve processes, products, services, or customer experiences. This means that business intelligence has a direct impact on the success of your company.
Business intelligence (BI) is a set of techniques and technologies that help organizations analyze enormous amounts of data and gain deeper insights by applying predictive modeling, analysis, reporting, and visualization. BI tools provide analytical capabilities to support all aspects of business operations, including marketing, sales, finance, human resources, manufacturing, supply chain management, IT, and many other areas. Business intelligence solutions typically include a few core functions such as data warehousing, query processing, statistical analysis, and report generation. They may also offer additional functionality like integration with external systems, enterprise application integration (EAI), or e-business platforms. The term is often applied to software implemented by mid-market and larger enterprises rather than smaller startups, although small companies may use similar technology internally.
In contrast to traditional database management system (DBMS) vendors, most business software providers build analytics capability directly into their product suite; they integrate analytic features with their base products without having to buy another toolkit. Also, business intelligence applications typically work well across multiple operating systems and hardware configurations.

Which Type of Data Can Be Used to Generate Business Insights?
Data comes in different formats and uses different languages, and each format requires a specific type of translation before being usable by a business intelligence solution. Data types include structured, unstructured, semi-structured, and NoSQL data. Structured data includes relational databases, XML documents, and flat files, while unstructured data includes free text, audio, video, images, websites, blogs, PDFs, and spreadsheets. Semi structured data includes JSON, RSS, Atom, and Web feeds. Finally, NoSQL data includes key-value stores, document repositories, and graph databases. Each of these data types needs to be translated so that it can be analyzed using BI tools.
Business Insights
The best way to gain insight into your business is by using a tool like Google Analytics. This free service allows you to track all the traffic coming to your site, so you can see which pages are most popular, which links people click on, and how they navigate around your website. It also gives you information on your visitors’ location (country), browser type, operating system, and device. Other helpful options include heat mapping, conversion tracking, and social media monitoring.
A notable example of this kind of data is the real estate market. You could create a table that has the property address, price, square footage, and other relevant information. Then you’d add data from every listing that’s ever been sold with the date of sale, whether it was foreclosed or bankrupted, and if the house were leased out. In addition to basic statistics about the properties that were sold, you could compare listings to see which ones were selling quickly versus those that took longer, based upon their asking price.
Using this same approach, you could create tables that contain the location, neighborhood, amenities, schools, crime rate, and any other factors.
Business Intelligence VS Business Analytics
Business intelligence (BI) refers to the collection and analysis of information from various sources. BI tools provide users with access to this information through dashboards, reports, and other visualizations. Business analytics (BA), on the other hand, is a set of techniques used to extract meaning from enormous amounts of data. BA tools allow users to explore, analyze, and visualize data using statistical methods.
One example of this would be the use of predictive models to predict customer behavior. A company might collect data on its customers, such as age, income level, and gender. They’ll then use machine learning algorithms to train the model. The trained model predicts future purchases based on customer demographics. Once the model is created, the BI tool will give the user views of the data that supports the model. For instance, the user may be able to view a chart showing how many customers made purchases within a given time range, broken down by demographics.
Business Intelligence vs Dashboards
are a vital part of business intelligence because they enable companies to make sense out of enormous amounts of data. Because BI tools generate reports and charts, they require plenty of storage space. If your company doesn’t already have enough hard disk space, you’ll need to buy additional space to store the data generated by BI tools. However, even when you do have adequate space, storing all the data generated by BI isn’t practical.
Dashboards are useful because they help employees keep up to speed on important metrics. Because dashboards are designed to show multiple pieces of data simultaneously, they’re more effective than individual reports or charts. You can display everything related to sales at once, instead of having to switch back and forth between tabs.
Business Intelligence vs Reporting Tools
Let users create custom reports tailored to exactly what they want to know. They can be used either internally or externally. Internal reporting provides the ability to produce reports for managers and executives, while external reporting creates reports for clients or potential partners. Some reporting tools also offer a mix of both internal and external capabilities.
Reporting tools tend to be more involved than BI tools. Users need to understand how to input data into the tool, select settings for the output, customize the report layout, and perform calculations. These steps require some programming skills, but most reporting tools include wizards and guides that walk the user step-by-step through each process. This makes generating complex reports easy, but it comes with the cost of more time spent training new hires.
Business Intelligence vs Data Mining
Refers to the practice of searching across vast databases looking for patterns and correlations. While BI focuses on analyzing historical information, data mining looks toward the future. It allows businesses to look beyond current performance and examine trends to find opportunities. Data mining has traditionally been done manually via spreadsheets and databases. As technology advances, however, businesses are finding ways to automate the process.
Data mining requires lots of computing power. Today’s tools use software called Hadoop, which distributes tasks across multiple machines. Hadoop enables data miners to find patterns without overloading their computers.
While there are still manual processes involved, data mining is much faster than similar BI tools. In addition, it gives organizations a better chance of spotting emerging trends before competitors. By looking ahead, these organizations can take advantage of innovative technologies before they become popular. For example, Twitter was able to capitalize on social media trends before Facebook had the same idea.
Business Intelligence and Analysis Tools
Compared to other products within the market. Businesses use analysis tools to determine how different solutions stack up against one another. Many of today’s analysis tools focus specifically on marketing campaigns; others can compare customer satisfaction scores against competitor products.
Analysis tools can provide many advantages, such as the ability to analyze large sets of data quickly. The downside is that they often come with a hefty price tag. Unlike BI tools, they don’t typically integrate well with legacy systems. Analysts must learn a new tool if they want to add analysis features.
The Human Barriers to Technology Adoption
The biggest barrier to adopting modern technologies is typically the lack of knowledge. People don’t know enough about technology to understand its potential uses or limitations. They may also feel uncomfortable using it because they don’t understand how it works. Even people who do know something about technology adoption regularly fail to fully utilize the tools available to them.
Technology adoption frequently involves learning how to use new tools and changing old habits. Some companies are starting to address this problem by offering virtual seminars. They provide real examples and demonstrations of how to implement specific applications. However, most companies still struggle to get their employees to embrace change.
If people remain ignorant of technological trends, the pace at which the world changes will continue to outpace them. To stay competitive, they’ll need to catch up. If they don’t, other companies will leave them behind.
The Top 10 Reasons Why You Should Use Business Analytics
1. Better Decision-Making
A thorough understanding of your company’s finances and operations will help you make smart choices. By identifying areas for improvement, you can increase productivity and profitability.
2. Higher Efficiency
Business analytics allows you to see exactly where your money goes. This insight helps you optimize your budget and improve workflow. Armed with this information, you can start saving time and money today.
3. Competitive Advantage
Having access to accurate financial information gives you the upper hand when making important product design decisions. You’ll be able to spot problems early and eliminate them from your offerings.
4. Improved Productivity
Knowing the cost of raw materials, labor, and overhead lets you set realistic production goals. You can then adjust your workforce accordingly.
5. Innovative Marketing Strategies
Modern businesses rely heavily upon social media to promote their brands. Marketers can leverage insights from business analytics to develop targeted strategies. For example, they could target customers based on their past purchasing behavior.
6. Customized Services
In addition to providing standard services, some companies offer custom services. These include accounting, payment processing, and bookkeeping. These services are especially useful for small businesses.
7. Customer Satisfaction
Customer feedback allows you to identify issues that might otherwise go unnoticed. When implemented properly, it can boost sales and retention.
8. Cost Savings
You can reduce costs through better planning and efficient deployment. Using business analytics, you can track key metrics and avoid overspending. You can also save time by automating routine tasks.
9. New Revenue Opportunities
By utilizing business analytics, you can find new ways to generate revenue. With information about customer demographics, interests, and buying patterns, you can tailor products and services to those groups.
10. Enhanced Security Measures
Security has become increasingly important in recent years. Companies like Amazon, Google, Apple, and Facebook collect a lot of personal data. The data they gather is valuable. It can be used to create targeted ads. But if you sell online and store sensitive information such as credit card numbers, then you should take extra security measures.

Utilizing Business Insights In the After of the Pandemic
In times like this, it’s essential to understand how your business will respond to changes in demand. If you don’t know what your customers want, you won’t be able to adapt quickly enough to meet changing demands. Fortunately, there are many tools that can help you get started.
1. Analytics & Data Visualization
To effectively manage change, you need to have real-time visibility into all aspects of your business. That means having access to reliable data. With analytics and visualization software, you can gain deep insight into trends, opportunities, and risks. You can use these tools to anticipate market shifts and prepare for emerging challenges.
2. Big Data Solutions
Big data solutions provide massive amounts of structured and unstructured data. They can give you a comprehensive picture of your entire operation, which is critical during a pandemic. As you plan your return-to-work strategy, you can analyze your current situation using big data technologies.
3. Predictive Analysis
can help you spot potential problems before they start affecting your company. It helps you learn what actions you should take when faced with uncertain situations. A good predictive model can allow you to see the future of your business.
4. Natural Language Processing
Natural language processing (NLP) tools work well within your existing systems. They help you connect relevant data directly to people. NLP tools convert text into meaningful information, helping you find answers and uncover useful insights.
5. Customer Relationship Management
Customer relationship management (CRM) systems track your customers. They automatically update records based on interactions with your company. CRM tools can identify repeat buyers and suggest additional offers.
6. Digital Marketing
Encompasses many strategies, but at its core, it involves reaching consumers through digital platforms. One way to do this is through social media marketing, where you share content and build relationships with customers. You can also use email marketing, search engine optimization, and pay-per-click advertising to spread brand awareness.
7. Social Media Monitoring
Social media monitoring allows you to track conversations happening across various channels, such as Facebook, Twitter, Instagram, LinkedIn, etc. You can then act accordingly—for example, by responding to customer questions or sharing timely news and announcements.
8. Chatbots
can automate simple tasks, freeing up time for human staff members. They can handle routine inquiries or answer frequent questions and queries.
9. Artificial Intelligence
The use of artificial intelligence (AI) has become increasingly prevalent over recent years. Companies like Amazon, IBM, Microsoft, Google, Oracle, and Apple are developing products that use AI to increase efficiencies and overall business performance.
10. Augmented Reality (AR)
Overlays computer-generated images onto real-world environments. The images appear realistic and blend seamlessly with the surrounding environment. You can interact with these augmented experiences using smartphones, tablets, webcams, projectors, headsets, or wearable tech.
11. Cloud Computing
provides users with access to all their files, programs, communications, and other online resources via the internet. With cloud computing, you don’t need to worry about hardware upgrades and maintenance. Instead, you just focus on writing code.
12. Machine Learning
refers to a set of technologies used for training machines to learn without explicitly programming. ML models are usually trained using data sets that have been labeled by experts. For instance, if someone were building a chatbot that could converse with people, they would label messages as being either helpful or unhelpful, based on some predefined standard. Then, when the bot receives new messages, it tries to understand which category they fall under. If it gets enough positive examples, it will start to generalize and recognize other related categories. As machine learning algorithms get better at analyzing substantial amounts of unlabeled data, they become even more useful for businesses looking to take advantage of big data.
13. Data Visualization
uses graphs, charts, maps, diagrams, and statistics to communicate information clearly. These visual tools provide fast and easy analysis of complex datasets. They allow organizations to quickly spot trends, anomalies, and correlations. They also give companies insight into the behavior of their customers. Data visualization allows companies to target specific audiences more efficiently through customizable content.
14. Content Marketing
involves creating relevant and interesting digital content that builds trust and brand recognition among potential clients. A company’s content should tell its story well so that readers want to know more about the product/service and buy it.
15. SEO (Search Engine Optimization)
SEO stands for search engine optimization. Companies use SEO techniques to improve their rankings on major search engines like Google, Bing and Yahoo!. Most small businesses don’t need to worry about optimizing their websites too much since there isn’t much competition out there. However, larger companies tend to rely on SEO due to the number of visitors that come from organic searches.
16. Targeting
is the ability to reach the right audience and convert them into leads and sales. At the end of the day, this is all anyone wants – to engage with the right people. You may think that everyone who visits your site is interested in buying, something, but that isn’t always true. The best way to find out what makes people tick is to ask them!
17. User Experience Design
User experience design focuses on making a user’s life easier and more enjoyable by designing products and services that meet their needs and expectations. UX designers understand these needs and translate them into tangible solutions. By combining creativity with usability research, UX designers create intuitive designs that lead users to take desired actions while minimizing errors along the way. Because good UX design results in satisfied customers, many marketers consider UX to be another form of conversion rate optimization.
18. Website Analytics
refers to the collection, analysis and reporting of data generated from visitors interacting with a website. To measure a visitor’s interactions with the website, web analytics collects detailed traffic data. Web analytics software helps companies learn if their website is reaching their goals. For example, many entrepreneurs use analytics platforms to help determine which parts of their websites rank well in search engines.
19. Search Engine Advertising
An Internet advertising campaign can benefit numerous diverse types of organizations. Some large companies leverage paid search ads to gain higher visibility. Other medium-sized companies use PPC (pay per click) advertising as part of their overall internet marketing efforts. Still, other companies invest in displaying network advertisements. Smaller organizations often use paid search ads to increase the presence of their products in local markets.
20. Online Reputation Management
Online reputation management is the practice of improving a customer’s impression of a business. This may involve removing negative information, adding positive information, or changing the appearance of a page to improve rankings. It may also involve taking down incorrect information or deleting outdated pages. Most businesses rely on SEO to drive traffic to their site, but it is just one method that is available.
21. Segmentation & Profiling
Segmentation and profiling are two techniques intended to divide consumers into groups based on behaviors and interests. These groupings can be made according to demographics, interests, location, age, income, marital status, education level, gender, occupation, hobbies, values, buying habits, website browsing history etc. Segmenting allows marketers to target specific individuals with tailored messages. Profiling enables them to learn more about consumer preferences so that they can deliver relevant messaging at the right time.
22. Sales Intelligence
consists of analyzing sales leads and contact database records, among many others, to extract useful information. This includes identifying potential customers, forecasting demand, predicting purchases, and developing new ways for prospects to interact with business partners. A sales intelligence solution improves the effectiveness of sales teams by increasing lead acquisition rates, closing deals faster, reducing operational risks, and boosting customer satisfaction.
There are many more, but I wanted to highlight insights that have not been mentioned before and give bigger context into how all these strategies will be part of your business strategy.
Emotional Metrics
One of the aftermaths after the pandemic has been the unknown for businesses. Typical business benchmarks have been shattered after the pandemic. One of the ways to overcome that is utilizing emotional metrics. After all the data and business insights human beings are the one’s that are making the decisions into the future of their company. If we identify what human behavior is, we can find strategies for moving our business forward. With business intelligence and measuring emotional metrics, we can adapt data to see what strategies are moving forward.
The goal of business intelligence (BI) is to help organizations make better decisions by providing insights into their data. Traditionally, BI has relied on metrics such as revenue, profit, and market share to measure success. However, these metrics often fail to consider the emotional factors that can impact business outcomes. Recently, there has been a growing interest in using emotional metrics to measure business performance. Emotional metrics provide insight into the emotional aspects of human behavior, which can influence business decisions. Emotional metrics can include things such as customer satisfaction, employee engagement, and social media sentiment. The use of emotional metrics can help organizations identify and address potential problems before they become too serious. Additionally, emotional metrics can be used to track the success of various business initiatives. For example, if sales results drop after implementing a fresh marketing strategy, this could indicate that customers did not feel satisfied with the product. In this case, an organization could adjust its strategy to ensure that future campaigns generate higher levels of customer satisfaction.
Emotions vs. Numbers
are facts about something or someone. For example, “John had 2 apples on his plate at breakfast today.” Or “The average customer spends $1,000 per year with your company.” These are facts that you can measure using data. On the other hand, emotions are feelings that people experience. For example, “I am feeling sad right now.” Or “My heart is beating fast because I just won my first cupcake baking contest.” These are not facts but interpretations.
Emotional metrics provide an opportunity for companies to gain insight into the motivations behind people’s actions. This allows them to better understand why certain products or services are popular, and who these consumers are. It also provides valuable information on how to improve your product or service as well as the overall customer experience. For example, it is possible to determine if a particular advertisement campaign worked based on whether the ad was effective at getting a specific emotion from viewers.
Why Use Emotional Metrics?
Emotions play a key role at all stages of the buying or selling experience. When you’re shopping for a product, it is natural that your emotions follow along with the experience. You may buy something because you like it, but if you don’t feel good about the purchase, then the emotion won’t last long. Likewise, when a company sells its products, emotions will affect the experience. For example, you may not want to buy something if you think the company is unethical or abusive.
How Can I Implement an Emotional Metrics Strategy into My Organization?
The first step towards implementing an emotional metrics strategy into your organization is to ask yourself what you really want. If you want to understand how customers feel about your products or services, then you need to look at your company’s data. Do you want to know if your product or service is popular with customers or not? Do you want to find out if your customers are happy or unhappy with your company? Do you want to figure out why people love or hate your company? These questions will help determine whether you should implement any emotional metrics strategy within your company.
How Do You Use Emotions in Your Decisions?
Before we get into the benefits you will receive from using emotional metrics, it’s important to understand how they work. While traditional business metrics tend to focus solely on the financial aspects of a company, emotional metrics incorporate both the financial and non-financial factors that influence a person or group. For example:
product quality
customer service
employee morale
These useful tools for making business decisions, emotional metrics are helpful when gauging consumer opinion. As more companies begin to adopt them as part of their marketing efforts.
The emotional metrics module provides insight into the emotions of your customers. This information will help you understand why they behave the way they do, which could lead to better customer service and retention strategies.
What Is the Value of Data?
The value of data lies in its ability to provide insight into your business. For example, if you want to understand why customers aren’t buying from you, you could analyze your sales records. If you want to know which products are selling well, you could look at customer feedback. Or, if you want to see which parts of your website visitors are most interested in, you could look at the pages they visit next. All these examples demonstrate how data analysis allows you to gain valuable insights into how your business is performing.
While data analytics tools might seem intimidating, there are many benefits you stand to reap once you begin using them. These benefits include:
Improve Customer Service
Data helps you improve customer service because it lets you predict what customers might expect next. You can then act accordingly. For instance, you could create an exclusive offer for a particular day, or you could send out promotional offers based on previous purchase history. Since predictive analytics uses historical data to determine future trends, it can help you customize services so that you can increase customer satisfaction.
Identify New Customers
Data also helps you find new customers. By tracking customer interactions, you can predict where people are coming from. This knowledge enables you to reach those individuals who you previously missed. It also gives you a chance to tailor your message to fit their needs.
Increase Sales
If you want to maximize your sales, you must first collect all the necessary data. When you enter this data into data analytics software, you can discover patterns within the data. Once you have this information, you can develop targeted marketing messages that resonate with your audience. As a result, you can start building relationships with prospective clients.
Gain Clarity on Your Budget
Analytics software makes budgeting easier by showing you exactly how much money each campaign will cost. You won’t have to guess how effective your efforts were. Instead, you can calculate the return on investment (ROI) of every campaign right away. Using this ROI as a benchmark, you can then decide whether to continue spending money on that initiative.
Benefits of Data-Driven Decision-Making for Business
The most obvious benefit of using data driven decision-making is that it allows you to make better decisions. It helps you understand what is going on within your business, so you can make informed decisions about how best to run it. This will lead to increased productivity and profitability. Data analytics also helps you achieve other important goals. They include:
Make More Money.
You can use data analytics to identify ways to increase revenue. Based on the results of your data collection, you may notice that some customers spend more than others. You could then contact them individually to encourage them to spend more. Alternatively, you may notice that certain areas of your business are underperforming. If this is the case, you could work on increasing traffic or changing your pricing structure.
Develop Loyalty Programs
Data analytics helps you build successful loyalty programs. When you use this type of program, you give special rewards to loyal customers. Then, when someone signs up for your program, you reward them for doing so. You could do so by offering them discounts on future purchases. Or you could award them with a gift. The key thing is that you need to choose something that is worth rewarding. It should not just be a simple thanks. You should really think carefully about the reason they joined your program.
Improve Market Competitiveness
When you use data analytics software, you gain insight into who your competitors are. You can see which ones are making more sales than you. From there, you can find new ways to market yourself. You can partner with another company. Or you can try something different. There are no limits to what you can do once you know what your competition is up to.
Reduce IT Costs
You can use data analysis to help reduce IT costs. Because of the many benefits that come from implementing data analytics within your business, it makes sense to invest in such technology. By collecting all your data, you can analyze it. This gives you insights that can save you time and money. For example, you can identify trends in customer behavior. With this knowledge, you can develop strategies to improve performance.
Better Serve Customers
The best way to serve customers is by providing them with information they want and need. This includes offering products and services that meet their needs and giving them access to the information they need to choose wisely.
Business insights focus on identifying what your customers really want from you instead of just knowing what they say they want (market research). Insight involves asking questions about your customer’s behavior such as:
Why do they buy where they buy?
What motivates them to make purchases?
How does this differ based on demographics?
There are several benefits associated with using business insights in your organization. For instance, by using BI, you can increase your productivity and gain insight into how different processes work within your organization. Additionally, you will be able to better understand trends at the departmental level as well as for your entire organization. Data that is gathered from BI reports provides a clear picture of where your organization stands today and what changes need to be made for your company to continue growing and prospering.
If you’ve ever tried to figure out where your company stands financially, you know how difficult it can be. There’s a lot of data to sift through, and it’s hard to keep up with everything—even if you have an analyst working full-time. But with a bit of effort, you’ll be able to get much more detailed information about your business.
Providing insight into your business’s performance, which helps you make more informed decisions about how to grow it over time. Giving you an understanding of what drives customer behavior, so you can better understand what makes customers behave. Helping you develop strategies for attracting new customers or retaining those who have already started buying from your company. Predictive analytics gives you insight into future events, and helps you anticipate trends before they happen.
By answering these types of questions more thoroughly, you will begin to understand who your customers truly are, so you can better position yourself to offer them exactly what they need.
Grow Sales and Improve Processes
The best way to grow sales is by improving processes. This means making sure that your company has the right systems in place so that it can efficiently manage its operations. Business Intelligence (BI) tools allow you to track sales trends and cycles, as well as customer buying patterns. With this knowledge, you can better forecast future sales and adjust your processes to ensure that you are providing the best possible customer experience. BI tools also allow you to analyze your competition and understand their strategies. Armed with this information, you can stay ahead of the curve and continue to grow your business.
Business Insights have become an essential part of growing businesses because they provide real value for making informed decisions. They give you insights into what’s happening right now, how your customers behave, which products and services people want or need, where changes in market conditions could be expected to occur, and much more. In short, they allow you to take advantage of new markets with confidence. You will also get a deeper understanding of your own business operations. Business insights software improves decision-making, streamlines workflows, reduces costs, and helps organizations run more efficiently. You will learn how your organization can benefit from using business insights solutions today; gain knowledge on how to get started with this technology; discover what type of BI solution you require for your needs; and find out which BI tools are available and their relative strengths and weaknesses.
It also means having the right people in place who understand those processes and can communicate them clearly to customers.
Engage More Customers
Business insights can help you understand customer behavior and preferences, which can lead to better marketing strategies. Companies that use BI tool sets can easily communicate with their customers through email newsletters, social media channels, and other forms of digital communication. This allows companies to stay connected with their existing customers as well as attract new ones.
Benefits of BI. There are several benefits associated with using business insight technology. For example, many organizations use BI to provide reports to executives, managers, and other decision makers. In addition, BI enables organizations to deliver more personalized experiences to their customers. At the end of the day, what does it really matter if your customers like or dislike your products? It’s not about how many likes or dislikes they have; it’s more important that the right product is delivered at the right time, at the right price, and through the right channels. To do this, there must be an understanding of the customers. And this will happen only when you have insight into their buying behaviors. This insight can be provided through direct interaction with customers. For example, you may find out that people who bought a product from you last week didn’t return to your site this month. This information could help you decide whether to keep offering that product or change it so that it appeals to new types of customers.
Cultivate a brand community
Brand communities allow you to connect with people who share similar interests and values. These connections can lead to new opportunities, like finding new customers or partners. In addition, brand communities provide a platform for sharing information and ideas, which can help you stay ahead of the competition.
BI software tools enable users to create reports that summarize data from multiple sources to provide insight into how customers interact with an organization and what changes need to be made to improve customer experiences. For example, a BI tool may provide a report detailing sales trends over time, or a report detailing sales performance across different regions. These types of reports inform decision makers about current trends and opportunities. Such reports should therefore be easy to understand without requiring extensive training or special knowledge.
Conclusion
With the pandemic fading from our collective memory, it is important to remember that traditional strategies still have an effect. However, businesses cannot return to business as usual and must adapt their strategies to the new realities. Data is a powerful tool that businesses can utilize to make better decisions, so it is essential to collect and analyze data to gain a competitive advantage. When it comes to making data-driven decisions, having BI in place will provide your organization with the competitive edge it needs. The benefits of BI are vast and include improved decision-making, increased efficiency, and better strategic planning. Not only that, but BI also allows organizations to identify and capitalize on opportunities early, which can result in increased profits. Implementing BI is a surefire way to improve your business performance and give you the competitive edge you need to stay ahead of the curve.