

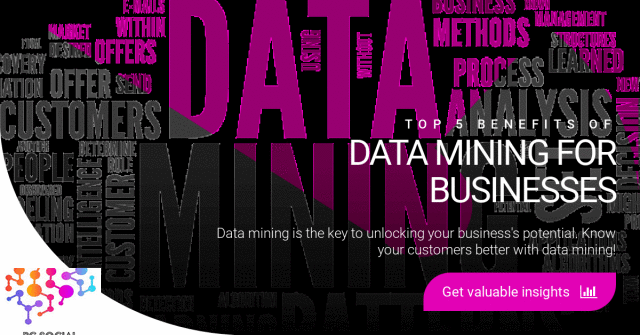
Top 5 Benefits of Data Mining for Businesses
Data mining has become an essential tool for businesses of all sizes. By collecting and analyzing data, businesses can gain valuable insights into their customers, their operations, and the marketplace. Small businesses can benefit greatly from data mining. With data mining, small businesses can compete with larger businesses by making better-informed decisions. Data mining can help small businesses in several ways. First, data mining can help businesses to better understand their customers. By analyzing customer data, businesses can learn about customer needs and preferences. This information can then be used to tailor products and services to better meet customer needs.

Additionally, data mining can help businesses to identify trends in the marketplace. This information can be used to make strategic decisions about where to distribute resources. Finally, data mining can help businesses to improve their operations. By analyzing data, businesses can identify areas where they can improve efficiency and reduce costs. Data mining is a valuable tool for small businesses. By collecting and analyzing data, businesses can gain valuable insights into their customers, their operations, and the marketplace.
If your company has been thinking of investing in big data, here’s everything you need to know.
Data Mining for Small Businesses
Data mining can be a game changer for small business owners who want to take their businesses to the next level.
Big data is one of the most exciting technologies to come along in recent years. This technology allows organizations to gather information about their customers, employees, products, competitors, and even the world around them. By analyzing this data, companies can gain insight into how to best serve their customers, what makes people tick, and where there are opportunities to make improvements. The problem is that big data isn’t easy to implement. Companies must invest significant resources to collect and analyze the data, and it takes time to develop algorithms that can turn raw data into actionable intelligence. But once you’ve done all of that work, the payoff can be huge. For example, a small business owner could use big data to figure out whether her store needs more inventory. A manufacturing firm might use big data to predict which machines will break down next. And a retail chain could use big data to find seasonal items that sell well during certain times of the year.

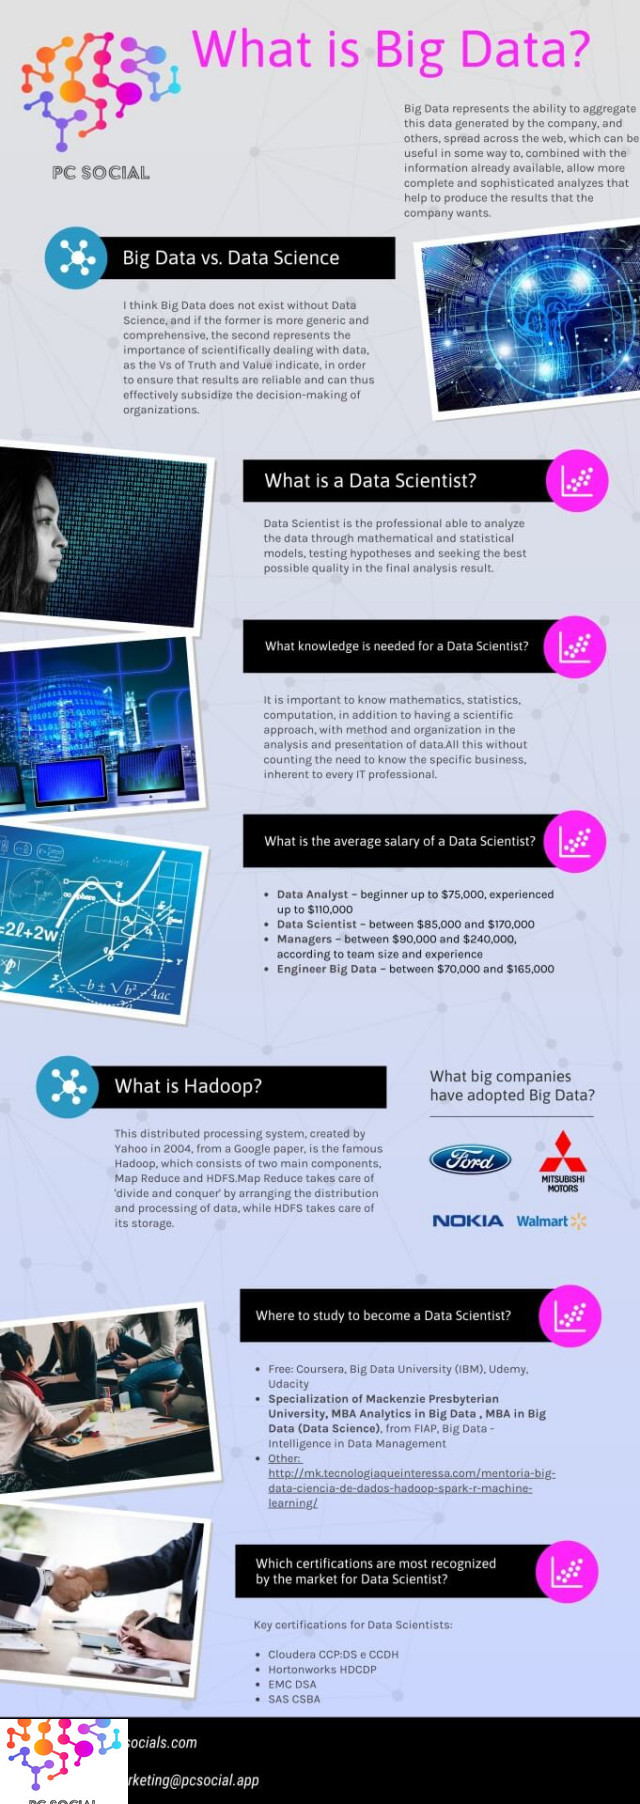
Let’s Start with Big Data
Big Data is a term that refers to analyzing large volumes of data to gain insights into human behavior. This includes everything from social media posts to online shopping patterns. Business intelligence is a tool that allows you to extract information from data, such as sales figures, customer satisfaction scores, inventory levels, and much more. This helps companies make better decisions about marketing, pricing, product development, and many other things. Predictive analytics is a method used to forecast future events based on historical trends. For example, it might help a retailer determine whether a certain item is popular enough to stock up on ahead of demand.
Discover the benefits of customizing your social media marketing with PC Social.
Fill out the form for a free demo. https://snkt.io/62bc94729c0efbf4098a5df5
Do small business startups utilize big datasets?
Small businesses are increasingly tapping into big data to help them understand how customers behave and what they want. They use it to identify opportunities to innovate and grow their businesses. But some challenges come along with big data analytics. One challenge is that many small businesses don’t have the resources to collect enough data to make sense of it. Another challenge is that most small businesses aren’t trained to analyze data effectively.
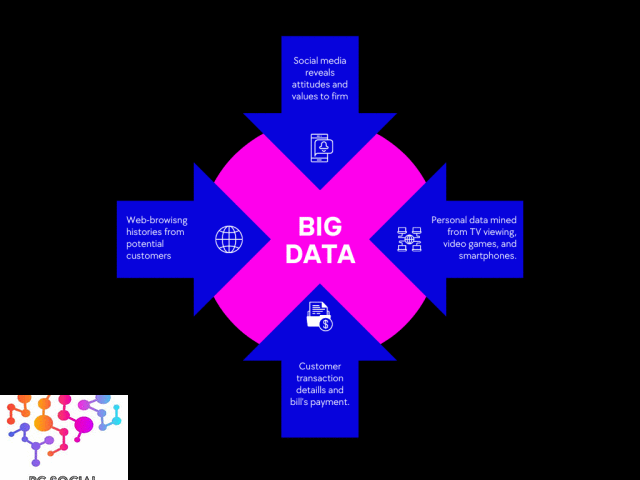
Big data is giving small businesses access to information about their customers that they never had before. This includes everything from social media posts to online purchases to the location where someone checked out. With this information, small businesses can learn more about their customers’ needs and wants. And once they know those things, they can develop better products and services to meet those needs and wants.
But big data doesn’t just give small businesses insight into their customers; it gives them actionable intelligence. For example, one small business owner used big data to find out that his customers wanted healthier snacks. So he developed a snack bar that offered healthy options like fruit juice and yogurt. He found that people liked the snacks because they tasted good, and they were easier to eat while driving.
Another small business owner used big data to predict trends in her industry. She noticed that consumers were buying more green products, and she saw that the demand for eco-friendly products was growing rapidly. She knew that her product could fill a niche market, and she launched a new line of eco-friendly cleaning supplies. And another small business owner used big-data analysis to figure out why customers weren’t returning to his store. He discovered that they didn’t return because they couldn’t find him. So he changed his hours and opened up earlier each day to let customers know exactly when he’d open. It helps identify the most relevant information for the business.
Big Data Solutions helps small businesses to understand how consumers behave online. This includes analyzing large amounts of consumer data such as web browsing history, social media activity, mobile app usage, email correspondence, and much more. With this insight, businesses can leverage the data to improve customer experience, increase sales conversions, and develop targeted marketing campaigns.
Small businesses can use big data analytics to optimize their operations. A study conducted by the University of California showed that companies with high levels of digital maturity saw a 10% improvement in profitability over those without it. In addition, companies with a strong digital presence can generate $4 billion in additional revenue per year.
Technology is changing rapidly today. With the advent of artificial intelligence and machine learning, we are now able to collect massive amounts of data about our customers and use it to improve customer experience.
- But what happens when you don’t know what technology to choose?
- How do you make sure that you’re choosing the best solution for your organization?
We will cover those questions in this article. These questions provide a fair idea of using the right technology. You’ll learn about the different types of technologies available, including cloud computing, big data analytics, social media marketing, mobile apps, and much more.

The need to understand the type of technology for your small business. Here are a few things to think about.
- Understand the difference between traditional IT solutions and modern ones
- Identify the key components of a digital transformation strategy
- Explain the pros and cons of each type of technology
- Learn how to evaluate the cost-effectiveness of technology
- Know how to identify the most suitable technology for your organization It gives flexibility and choice.
Big data analytics allow companies to automate processes and gather insights into customer behavior. These are some benefits of big data analytics. Marketing automation tools help small businesses run day-to-day operations while keeping up with changing market conditions. They provide a platform where marketing teams can create personalized experiences for consumers based on their preferences.
They give companies the ability to make better decisions about how to spend money. For example, they can use predictive modeling to predict future trends and usage patterns. This way, they can allocate resources efficiently. It helps find trends. Big data mining is one of the most powerful tools marketers use today. It allows businesses to make predictions about customer behavior based on historical data. This information can help marketing teams figure out how best to reach customers and adjust strategies over time.
Trends are another tool big data analytics offers to marketers. They allow companies to see where consumers are heading and provide a glimpse into the future. In addition, trending topics can help brands connect with potential customers and communicate relevant messages. Trending news is a great example of how big data analytics can inform marketing decisions. Companies like Facebook and Twitter track millions of pieces of information about people every day. These insights can help marketers understand what their audience wants and need, and even anticipate changes in demand. Helps in staying ahead in the competition
Big data helps businesses understand customer behavior better. This allows you to make smarter decisions about products and marketing campaigns. For example, it could help you identify trends in product usage and improve your customer experience. Companies can use big data analytics tools to track competitor strategies through online activity. They can even compare their performance against competitors. If you want to know how well your brand is doing, you can look at what others are saying about it online. You can also see where people are talking about your brand versus another one.

The Benefits of Data Mining
Data Mining is used to help organizations make better decisions. It can even help you decide what to do next. To understand how data mining works, let’s take a look at some examples. Suppose you are running a restaurant and want to know whether people like your food. You could ask customers directly, but that might be too expensive. Instead, you could use data mining to find out what people say about your food online. For example, you could check reviews on Yelp and see what people had to say about your pizza. If most people liked it, maybe you should keep making pizza. On the other hand, if many people didn’t like it, maybe you should stop selling pizza altogether.
Businesses often use data mining to find patterns in customer behavior. They use this information to predict future trends and choose the best course of action. For instance, suppose you sell clothing and shoes. You can use data mining to figure out which items are popular among men and women. This lets you adjust your inventory accordingly. Or you could use data analysis to figure out which colors are most popular. This way, you don’t run out of stock of those items.
Data mining is especially useful for companies whose products change often. Imagine a retailer that sells clothes. Each season, the store needs to figure out which styles will be hot and which ones won’t. Using data mining, the retailer can learn from earlier seasons and avoid wasting money on unprofitable designs. In addition to helping businesses make better decisions, data mining can also help individuals make smarter choices. For example, imagine you are looking for a job. You can use data analysis to discover which jobs pay well and which ones aren’t worth your time. This makes it easier to focus your efforts on finding a good career path.
Dictates Trends
Big Data Analytics is an important part of any business strategy. But it can be difficult to translate raw data into actionable information. A big problem is that many companies use vanity metrics like follower counts and likes without understanding what those numbers mean. Some companies even pay people to follow them on Twitter just because they want to see their number go up. This type of behavior is called “vanity metrics,” and they are useless for gauging success.
Small businesses should know the difference between vanity metrics and meaningful ones.
Vanity metrics include things like followers, likes, retweets, and comments. They don’t tell you anything about whether someone cares about your brand. For example, a lot of people tweet about brands they love, but they rarely interact with those brands. On the other side, real conversations are happening on Twitter every day, and those conversations are often centered around topics relevant to your product or service. These types of interactions are known as “meaningful metrics.”
Vanity metrics also don’t usually have much value in terms of ROI (return on investment). If your goal was to drive traffic to your website, then most social media metrics would probably do the trick. However, if you’re trying to sell more products through Twitter, then there’s no way to measure how well you’ve done based on follower count alone.
The Value of Vanity Metrics
There’s nothing wrong with having a large following on Twitter. It certainly doesn’t hurt to have lots of fans, and it can help build credibility when sharing content. However, the key is finding out where all that attention comes from. If you only focus on vanity metrics, you may not realize that your efforts are being wasted.
Consider this: At one point, my company had over 1 million followers. We didn’t get anywhere near that level of popularity by paying people to follow us. Instead, our followers came organically due to great content and solid engagement. That means we were successful at engaging customers, which makes sense since we’re a B2B software company focused on customer support. When we did something right, our customers shared that news with other potential customers, so word spread quickly. As a result, we saw our follower growth increase steadily month after month. If you look carefully, you’ll notice that most vanity metrics aren’t very useful for measuring success. Take Twitter follower growth for instance. Most companies will say their follower count increased by 30% last month. Is that impressive? I’d argue it isn’t. After all, we could easily add 30 new followers each week, and still not grow our base by much.
When you compare 30% growth with the same amount of growth over a longer period, however, it looks different. Let’s pretend we started with 100 followers and added 10 per week for six months. By the end of the sixth month, we ended up with 200 followers. During that period, we grew by 20%. Now let’s say we continued growing at that rate for another year. In the first six months, we’d have 600 followers; in the second six months, 800; and so on. By the end of the 12th month, we’d have 12,000 followers. We’d be able to see that our growth has slowed down significantly during the past two years, even though we haven’t made any changes to our marketing strategy. The reason is simple: — we started with a small base and grew slowly until we hit our saturation point. Once we reached that point, our growth leveled off.
Now look at the next chart. This shows the same data set, except instead of looking at monthly growth, we looked at weekly growth over the course of 6 months. To keep things consistent, we took the number of followers we had at the beginning of each quarter and divided it by 4. So in the first column, we start with 100 followers and divide that by 4 to give 25 followers per week. Then we multiply that number by 52 weeks, and voilà! Our total number of followers for the entire year is now equal to the original 100 followers divided by 4 again. As you can see, the same slow growth pattern applies here as well. Even though we went from 100 followers to 400 followers in just six months, we gained less than half that many followers in the long run. Why? Because the majority of those 400 followers were acquired in the first few weeks or months of the year. Since we hadn’t grown much before they joined our team, they only added a minimum amount of value to our overall follower count.
This brings me back to my original question: What do these numbers mean? They don’t tell you anything about your business unless you know how many followers you already have. If you don’t know what your current follower count is, consider doing some research. You might find out that your competitors are more popular than you are, or maybe you’ve been following them for a while, and they’re starting to catch up. Whichever case is true, you need to know whether this is good or bad for your business. It’s important to understand that follower growth isn’t the only metric that matters. While it’s easy to measure, it’s meaningless if you don’t also track other important metrics, like revenue and conversions. For example, if you sell widgets online, you’ll want to know how many people visit your site each day. That way, you can plan your content accordingly. Similarly, if you sell services online, you’ll want a detailed breakdown of exactly who uses which service.
One thing to note is that I’m using “follower” as an umbrella term. There are several types of social media users. Some follow brands because they enjoy the product or service. Others follow businesses because they want information and/or discounts. Still, others may follow both. The bottom line is that vanity metrics are great for bragging rights but not extremely helpful when it comes time to make decisions. There’s evidence showing that companies’ performance suffers when they focus too heavily on vanity metrics. When you think about it, there are two kinds of followers: active and passive. Active followers respond to your posts, while passive followers simply let you post without engaging. Both types of followers add distinct levels of value to your account.
For instance, a brand with 50,000 followers could have an average engagement rate of 1%. That means that for every 10,000 followers, one would expect their followership to increase by 0.1%. However, a brand with 500 followers would only expect to gain 0.5% for every 10,000 followers. You should be spending more time measuring your ROI (return on investment) and less time focusing on vanity metrics. When you do so, you’ll see that your efforts are paying off in meaningful ways that will ultimately help you grow your business.

Learn How to Convert Social Media Data into Sales
Are you looking to convert social media data into sales? If so, you’re not alone. In today’s digital age, more and more businesses are using social media to connect with their target audiences and generate leads. However, simply having a social media presence is not enough. You also need to know how to collect and analyze social media data so that you can make informed decisions about your marketing strategy. By learning the basics of collecting, analyzing, interpreting, and reporting on social media data.
Boost your sales by up to 600% Improve the quality of your leads by up to 80% Grow your business by growing your brand recognition Get more leads from social media than the average marketer Boost your online reputation online and offline Become an authority on social media marketing Join thousands of marketers in the monthly Facebook group, “Convert Social Media Data into Sales”, where you can ask specific questions and get specific answers.
Convert Social Media Data into Sales is broken down into three parts:
- The Secrets to Successful Social Media Data Collection.
- How to Use Social Media Data for Sales.
- Advanced Marketing Using Social Media Data for Lead Generation.
The Secrets to Successful Social Media Data Collection
Collecting data from social media marketing sites; Being in the right place at the right time, on the right page, with the right content; Using multiple data collection methods (listening and reading, listening and reading, reading and listening); 3 ways to slice, dice and analyze the data; understanding who, what and where the data is coming from; preparing for anything that may be thrown at you; researching and planning for all kinds of situations. By learning how to use social media effectively, you can find your target audience and collect the data required to make your business more successful.

There are three key points that you need to focus on when collecting this data:
When collecting social media data, understand the social media platform you are using. Understand the type of content you will be publishing and the type of interactions with other users the content will generate. Be mindful of how much time you want to invest in your content creation efforts because you will need to be selective about what you publish, and when you publish it. The more time you spend on your content creation, the more valuable that content will be when it is published. Find the audience that you are trying to reach; record the data; and apply your findings. Once you have collected the data, you need to analyze it.
Anticipate
Your first step is to predict what your audience expects from your page, what they are looking for, what information and products they are looking for on your page, where they are coming from, etc. This will help your audience to find you and provide you with useful feedback on what they are looking for.
What do they expect?
This is where you need to figure out what makes your page unique, and how you can offer that to your visitors. Dig into the numbers.
- What products are getting the most views?
- What are the most searched keywords in your niche?
- What are the most clicked categories?
- What are the top pages?
To do that, you need to understand the industry you are in and the social media platform you are using. You also need to analyze your competition and know what they are doing. Once you have this information recorded, you need to start analyzing and understanding the data.
- Are you blogging about a product that customers are looking for?
- Are you blogging about a product for a particular market?
- Are you blogging about a product for the entire world?
- Are you blogging about it from a customer’s perspective or a business’s perspective?
All of these are important questions to ask yourself before you publish content.
Analyze
Once you have your data, analyze it to figure out the most successful content, where to publish that content, and when. You’ll need to determine which of your posts are performing best, what content is the most popular, and what approach to take with newer customers.
With each post that you publish, you will want to start finding what content performs successfully, while also looking at what type of audience you’re reaching with your content. In this way, you can perfect every post that you publish. There are a lot of tools out there that help you do this. One strategy I use is to create a spreadsheet that has all my content broken down by month, based on the number of views, clicks, sales, and conversions. I also try to understand how much time is spent on the pages, which in turn helps me figure out what my social media goals are and what content to publish.
Measure
I use the analytics from Google Analytics and Facebook Insights to see how many times people are viewing content, what sites they’re visiting, and when. Once you know what content is performing well, add it to your schedule and make that content a priority to get published. When you are publishing that content, take time to understand the outcome of the post, if people are reading, who they are and how they are responding. I also can then see which pages have a higher amount of time spent. You can find a snapshot of the spreadsheet that I use here. Another one of my favorite tools is Buzz Sumo. Buzz Sumo is a great tool that helps you find the top-performing content and then find what that content is and how it performs. Once you know what content performs successfully, you can perfect your blog posts to reach that type of reader.
A fantastic way to do this is to identify what content you want to build a relationship with and then build that content into your blog that way.
Should you use analytics for your blog?
The answer is a resounding yes! You can use analytics on your blog to help you create great content. You can use analytics to find out what content is working and perfect your blog so that everyone is getting great content. The Takeaway From this post is that you need to continually question yourself if your blog is connecting with the right people and if your work is worth it. You need to continually evaluate how being on the internet is helping you and if the work you have put in is being rewarded.
Marketing Campaigns
Focus on different segments of the market based on their needs and desires. This way you can reach out to each group effectively and tailor you’re messaging accordingly.
Data mining helps marketers decide what type of person they are targeting. They use data such as demographics, psychographics, behavioral patterns, interests, location, and buying history to figure out how best to communicate with consumers. Once they know whom they want to connect with, they can personalize their messages to make them more relevant to that specific consumer. Personalization allows brands to send targeted messages to individual customers. For example, a brand could say something like, “Hey, Bob! Here’s a coupon for your favorite coffee shop. “Hi there, Mary! We noticed you’ve been looking for a good deal on a new mattress recently. Let us help!”
Customer Patterns
Data mining is the analysis of substantial amounts of data to identify trends and predict future events. It helps you make predictions about future events by looking at what has already occurred. For example, if you see that people tend to buy shoes during winter months, you could start selling boots during those times. Data mining is used in many industries, including marketing. Companies use data mining to understand customers, predict trends, and improve sales.
Customer Retention
Data mining helps businesses learn more and better understand their customers. This information can help companies develop targeted marketing campaigns, offer promotions and make smarter decisions. Marketing automation tools are designed to collect data about consumers and use it to improve the customer experience. Offers like coupons and discounts, and even free shipping can increase customer loyalty. Customers who receive special offers are more likely to purchase again. A study conducted by the University of Michigan found that people who received a coupon for $10 off their next purchase spent $29 more per month than those who did not receive one.
Revenue
Data mining helps businesses analyze their customer’s buying habits. This helps companies decide what products to offer and how much to charge for those products. Data mining lets you plan future sales activities and optimize your inventory. Data mining makes sure you do not run out of stock or sell too many items. It also helps you identify which products should be discontinued. The most important thing to remember when using data mining is that it will only work if you have enough data. If you don’t have enough data, then you won’t get any results. You need at least 100 transactions to get meaningful results.
It predicts who’s leaving (and why) for you.
Data mining isn’t just about predicting market trends. It can also help businesses improve employee retention. Big data can help companies identify those who are likely to leave before they do. The process starts with collecting data on everything from job performance to office politics. Then, you analyze it to find patterns and correlations. You might even look at how much money each person makes, what type of work he does, and his age, gender, and education level. Once you’ve collected enough information, you’ll start building models to predict future behavior. You could use predictive analytics to determine whether someone will leave based on his salary, tenure, and current position. Or, you could use data mining to understand why some employees decide to leave. For example, you might see that women tend to leave jobs where there aren’t many opportunities for advancement. You might conclude that men don’t want to join a team where they’re outnumbered by females. Once you know what types of people are most prone to leave, you can take steps to prevent turnover. For instance, you might give certain workers more responsibility or offer training programs that teach skills needed in high-demand industries.
We’ve got some use cases and examples for you
In the world of business, data mining is used to make predictions about customers, products, and events. In retailing, it’s used to determine how much inventory in the stock is based on customer demand. Insurance, helps companies predict the probability of natural disasters and the cost of rebuilding homes and businesses. And in healthcare, it helps doctors identify patients most likely to benefit from certain treatments.
Data mining is used to find out what makes people tick. For example, retailers use data mining to target specific demographics and interest ads. Companies like Amazon use data mining to analyze online reviews and recommend products to customers. Insurance companies use data mining to help them decide which policies are best for their clients. Healthcare providers use data mining to diagnose illnesses and prescribe treatment. The goal of data mining is to uncover patterns in large sets of data that can be used to make accurate predictions or recommendations. Data mining techniques include statistical analysis, machine learning, and artificial intelligence (AI). These methods allow you to discover hidden relationships among variables.
Statistical Analysis involves finding patterns in data. This method works well for analyzing small datasets because it doesn’t require a lot of computing power. However, it has several drawbacks:
- It requires a large amount of data.
- It may not reveal all possible patterns.
- It relies on assumptions that may not hold.
- The following sections describe the different types of statistical analysis and how they can be used to analyze your data.
Descriptive Statistics
A descriptive statistic is a numerical value calculated from a dataset. Descriptive statistics are useful when you want to summarize or compare information about a group of people or objects. For example, a researcher might calculate the average age of a group of people or the number of times a product was sold over some time.
Summary Statistics
A summary statistic is a measure of central tendency, the middle point of a set of numbers. The mean is one type of summary statistic. It’s often used as an indicator of central tendency because it represents the center of mass of a distribution. The median is another type of summary statistic. Like the mean, the median divides the data into two groups based on whether the values fall above or below the median. In other words, the median indicates where half of the values lie.
Correlation Coefficient
A correlation coefficient measures the strength of a relationship between two variables. Correlations are important because they indicate whether there is a connection between two things. When you have multiple observations of a variable, correlations are also helpful in determining whether those observations are independent (i.e., unrelated). This involves using mathematical techniques to extract knowledge from data. Data mining has many applications, including marketing research, fraud detection, customer segmentation, and business intelligence.There are three main categories of data mining: supervised learning, unsupervised learning, and reinforcement learning. Supervised learning is the most common form of data mining. In this case, the data is labeled with known answers. Unsupervised learning uses unlabeled data. Reinforcement learning is a combination of both supervised and unsupervised learning.
Supervised Learning
In supervised learning, the data is labeled by experts. A good example of this is credit scoring. An expert would label the data as “good” or “bad.” Another example is predicting which customers will buy a particular product. You can use supervised learning to predict what products customers will purchase next.
Unsupervised Learning
In unsupervised learning, the data is unlabeled. One example of unsupervised learning is clustering. Clustering is a way to organize data so that similar items appear together. Clustering is useful for finding patterns within data.
Reinforcement Learning
In reinforcement learning, the data is not labeled. Instead, the computer learns through experience. Reinforcement learning is useful for tasks such as playing games. Machine Learning uses algorithms to learn from data without being explicitly programmed. It’s often used to build computer systems that perform tasks such as speech recognition, image processing, and text categorization. Machine learning is a field of artificial intelligence (AI) that focuses on the design and development of intelligent machines capable of acquiring knowledge by analyzing data. The term “machine” refers to any device or system that can be instructed to automatically carry out some task according to fixed rules. A machine can be anything from an abacus to a space shuttle; it could even be a human brain! The word “learning” means that the machine acquires new information and adapts its behavior accordingly.
Types of Machine Learning Algorithms
There are several types of machine learning algorithms. Some of these include:
- Neural networks
- Natural language processing
- Speech recognition
- Image recognition
- Computer vision
- Object recognition
Artificial Intelligence is an umbrella term that includes any system designed to mimic human thought processes. AI is commonly used to create chatbots, self-driving cars, and other intelligent machines.
The field of artificial intelligence was first proposed by John McCarthy in 1956. The term “artificial intelligence” was coined by Allen Newell and Herbert Simon at the Dartmouth Conference in 1955. In 1957, they published their seminal paper on the topic: “A Framework for Representing Knowledge”. This work laid out a formal definition of what constitutes knowledge and how it can be represented. It also introduced the notion of a general problem solver, which became one of the cornerstones of modern AI research.
The Future of Data Mining
We take it for granted, but it’s one of the most important technologies of today. Many people believe that data mining will become increasingly important over the next few years. Data mining has come a long way in recent years, and it shows no signs of slowing down. With the ever-growing amount of data being generated by businesses and individuals, the need for effective data mining tools and techniques will only continue to increase. In this article, we’ll take a look at the future of data mining, and some new and exciting techniques that are being developed to help make sense of all this data.
Big Data, Big Problems
The volume of data being generated today is tremendous. Many believe that this amount of data is so large that it will overwhelm the human brain. This may be true one day, but for now, we’re still making progress. Many are convinced that the human brain is still leading us in terms of the amount of data that we can compute and analyze.
The algorithms companies currently use to process this data are just as important as the data itself. The volume of data is growing faster than the ability to process it. The challenge that companies are facing today is similar to that of trying to walk into a swimming pool when the water level has risen so much. There’s so much data around that it’s hard to retain it all. A single business may generate up to a billion pieces of data per day. This is why advanced data mining techniques are now finding their way into various fields. Many have also started investing in data mining technologies, including financial services and healthcare, to gain a competitive edge.
One of the biggest problems that we’re facing is the fact that people are only now starting to realize the true potential of data mining. There have been many great applications of data mining, but none have been as effective as the ones already in place today. The latest innovations seem to be very promising in terms of creating more value from data by making things easier and more efficient. While we’re experiencing the biggest growth in data, there are also some serious threats to privacy and security. Most people are sharing more and more personal information on the Internet. This is what makes building data mining technology essential. Tracking targeted consumers and giving them more trust and confidence is one of the main goals of most online companies, along with other business objectives.
Bottom line is that data mining is vital for the future. It’s vital for our economy and the protection of both privacy and security. We’re facing a huge challenge in terms of privacy, and consequently, we’re also exploring new methods to improve data mining.
Conclusion
Data mining can provide small businesses with several benefits, from improved customer relations to increased sales. However, it is important to note that data mining should not be used as a replacement for good business practices. In other words, data mining should be used in addition to, not instead, traditional methods of marketing and customer service. When used correctly, data mining can be a powerful tool that can help small businesses to thrive.